| "At the end of the day, boys, you don't tell me how rough the water is, you bring in the ship." – Steve Stone | |||
|
|
|||
• Wrigley Rooftop Directory
|
Ballplayer ValuationsThursday, September 2, 2004
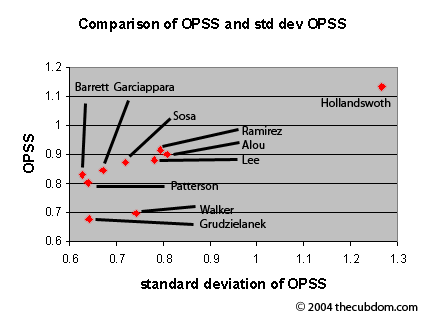
As you may (or may not) know, I am a finance student at the Kelley School of Business at Indiana University. For the past few months, I have been mulling over an idea in my head about how to evaluate (non-pitching) ballplayers in view of their batting abilities and salary. To do so, I am going to apply some techniques used in evaluating stocks. We begin... In Finance, a stock is evaluated on two key factors, its return (stock price change) and its risk (standard deviation of stock price change). Likewise, I believe ballplayers should be evaluated on their ability to produce runs (OPSS) and their consistency in doing so (standard deviation of OPSS). Essentially, I would rather have a ball player (player A) with a .200 OBP (I am using OBP for simplicity) who gets on base 1 out of 5 plate appearances per game, rather than a ball player who goes 5 for 5 one day, and 0 for 5 the next four days (player B). Although these players may have identical OPSS, the player who consistently produces every game will give your team a better chance to win more games. If you are like most people, and aren't in-touch with your inner standard deviation, let me give you a quick explanation: A standard deviation measures consistency. The smaller a standard deviation, the more consistent the result. In the above example, player A has a standard deviation of 0, because every game he does the same thing (there is no deviation of his daily OBP from his average OBP). Player B has a standard deviation of .8 because in the first game his OBP is .800 higher than his average, and in games 2, 3, 4, and 5 his OBP deviates .200 from his average OBP. (These deviations are squared, added together, and then square rooted for mathematical reasons.) Returning to our stock analogy, would you rather purchase a stock that has grown by 20% every year without fail, or one that averages 20%, but booms and busts its way there? Of course, no stocks (or ballplayers) fit the above model, and things become more complicated when you start changing some of the numbers. For instance, would you rather have a stock that swings wildly, but earns 20% returns, or one that earns 15% every year? There is no right answer. Similarly, would you rather have ballplayer with a .900 OPSS who is wildly inconsistent, or one with an .850 OPSS who is very consistent? So, before I lose all of you, lets see the obligatory picture.  What does this tell us? The way to interpret this picture is this: If you can draw a line up, and a line to the left from a players point, any other data points falling in the box are better hitters than the first player. For example, Sosa, Garciappara, Patterson, and Barrett are all better hitters than Todd Walker because they are both more consistent (smaller standard deviations), and have higher OPSS. Likewise, Aramis Ramirez is a better hitter than Moises Alou, but not necessarily better than Sammy Sosa. (Believe it or not, Sosa has been more consistent this year than Ramirez.) Anyhow, its getting late, almost past my bedtime, so I will continue this post later and incorporate some other ways of evaluating a ballplayer like a stock.  Cubs beat the Expos 2-1 in 11 innings.  'Spos trounce the Cubs 8-0. Posted by Byron at September 2, 2004 10:13 PM
|
|
||||||||||
| Subscribe to The Cubdom - get emails with the latest Cubs info and pictures | |
This post has been tagged: |