| "At the end of the day, boys, you don't tell me how rough the water is, you bring in the ship." – Steve Stone | |||
|
|
|||
• Wrigley Rooftop Directory
|
Markie FranchiseFriday, January 28, 2005Some more analysis through charts. Today's subject: Mark "The Franchise" Prior. 
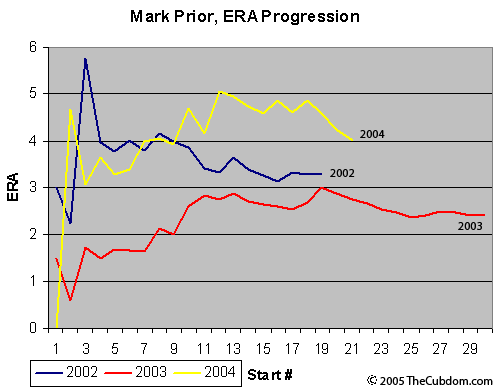
The first thing I notice looking at this chart is the shorter lines for 2002 and 2004. Prior is in his third season as a starter, but has failed to remain perfectly healthy in any of the three. His first start was May 22, 2002 and he started 19 more before being shut down for the season on August 31 with a strained left hamstring. In 2003, he collided with Marcus Giles and was out of commission from July 11 through August 5. Whats suprising though, is even after taking a month off in the middle of the season, he still started 30 games in 2003. In 2004, we all remember the achilles tendon injury and the daily Prior updates. He returned in early June and pitched for the rest of the season. Tracking his ERA across the three seasons shows a fair amount of in-season fluctuation in all three years. However, unlike Zambrano who has an upward sloping ERA towards the end of all three seasons, Prior appears to be a strong beginner and finisher, but his seasonal ERA has peaked towards the middle of each season. 
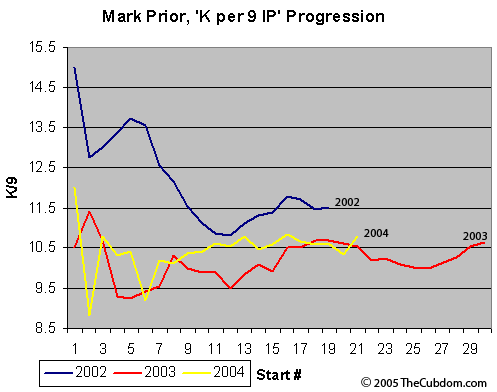
Take a glance at the axis labels on this chart! Off the wall. I started the minimum at 8.5 K/9. Essentially, Prior has gone his entire career striking out at least one batter per inning, and often times a few extra during the game. Aside from 2002 where Prior started off by striking out an astronomic number of hitters, he has been rather consistent throughout his three seasons. My guess is that Prior was getting several K's in his first few starts from batters who had never seen him, or video of his pitching. After the batters adjusted, and he re-adjusted he settled pretty consistently into his normal 10.5 K/9 IP. 
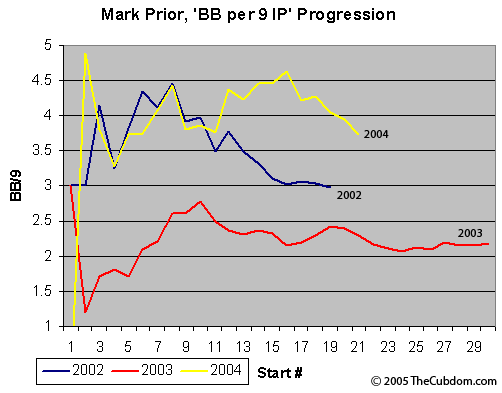
This chart is troubling. Prior walked about 1.75 batters more per nine innings in 2004 than he did in 2003. In fact, Prior's 2004 chart is nearly identical to his 2002 line, until about the 12th start. After the 12th start, 2002 Mark Prior virtually stopped walking guys while the 2004 Mark Prior took 16 starts before he noticably improved his control. Even more interesting, the 2003 Prior showed the same in-season progression as 2002 and 2004, but about a walk and a half lower. However, with two of the three seasons showing dangerously high levels of walks, I would suggest Mark move down the bench a couple of seats and sit nearer to Greg Maddux than Kerry Wood. 
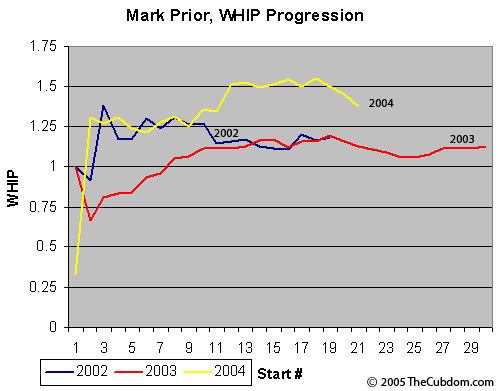
The WHIP (Walks + Hits / Innings Pitched) lines for each three years are eerily similar. Again, Prior started all three seasons well, struggled a bit during the middle of the season and finished strong. His 2002 and 2004 seasons began almost identically, and the 2002 and 2003 seasons were similar in the way they ended. The worrisome issue of course is that Prior's 2004 season ended with a quarter of a man extra on base per inning than in 2002 and 2003. Taken together, the four charts show us the same thing we already knew intuitively. Mark Prior has a ton of potential and looked like he was realizing it late in 2002 and throughout 2003. However, during the 2004 season, Prior struggled and looked much more pedestrian than a guy with the nickname: "The Franchise." All that said, I told Miss Fantastick last week that I thought Prior had a great shot at winning the Cy Young award this year... if Carlos "Cy" Zambrano doesn't beat him to it. Posted by Byron at January 28, 2005 3:40 PM
|
|
|||||||||
| Subscribe to The Cubdom - get emails with the latest Cubs info and pictures | |
This post has been tagged: |
Leave a comment