| "At the end of the day, boys, you don't tell me how rough the water is, you bring in the ship." – Steve Stone | |||
|
|
|||
• Wrigley Rooftop Directory
|
Woody ReviewWednesday, February 9, 2005Yes, the Farns was traded today. He'll be a Tiger next year, and the Cubs will receive Roberto Novoa, Scott Moore, and Bo Flowers. If these names don't mean anything to you, you're not alone. However, I have it on good information that these individuals are a reliever, a third baseman, and an outfielder. That said, we now return to our regularly scheduled programming: Kerry Wood. Kerry Wood, the great Cubs hope has had an on-again-off-again career with the Cubs. He has been slowed by injuries during his career and has always shown tremendous potential. Well, a quick peak at some of his most important rate stats over the past three years indicate that he has settled down and gives us a good idea of what we can probably expect for the next few years. 
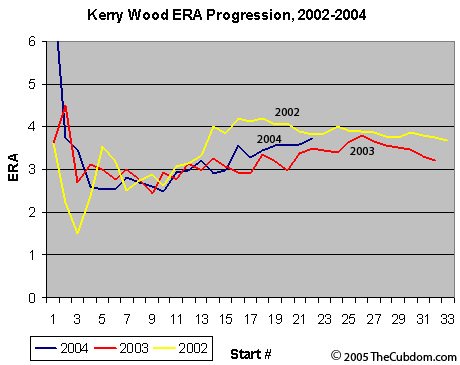
This ERA chart shows three very similar years. Although 2002 started well, 2003 and 2004 saw ERA spikes at the beginning of the seasons. However, after a few games, the numbers are all virtually identical by the eighth start. After that, Wood's seasons have all played out pretty similarly. He was noticably better in 2003 than he was in 2002, and his 2004 season 'seams' to lie in the middle :) 
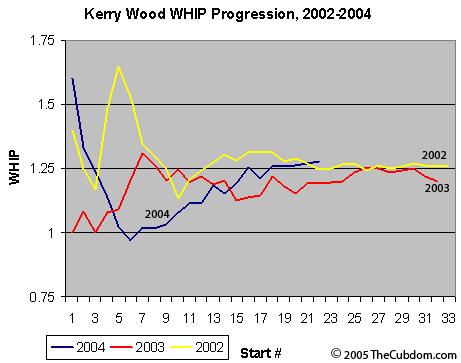
The WHIP progression shows a suprising amount of variance early in each of Wood's previous three seasons. His 2002 and 2004 seasons show some early season inconsistencies. In '02 Wood had some very good games, and some very bad games, making his line look more like a heart beat than a curve. In 2003, Wood was fairly consistent throughout the season after a strong start. In 2004, Wood had the same strong start but had consistent trouble keeping men off the bases after his sixth start. However, he ended all three seasons with virtually identical WHIPS of about 1.25. 
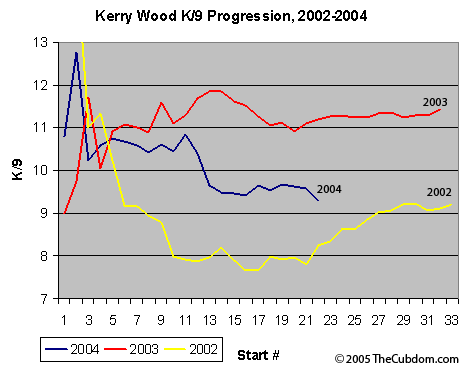
Wow! After the first couple of graphs looked like a rope of three cords, this chart has got a significant amount of seperation. In 2002, Wood 'struggled' to strike guys out, 'only' striking out about one batter per inning. His final total was helped by a late season push, but he spent a third of '02 below 8 K/9. In 2003, Wood started striking out opponents at an amazing clip of 11 K/9. He was above this threshold nearly the entire season and showed a rather consistent rate throughout the year. In 2004, this rate declined a bit and he finished the season at about 9.5 K/9. However, he suffered a pretty significant decline half way through the season. This decline coincides with his return from injury in 2004. 
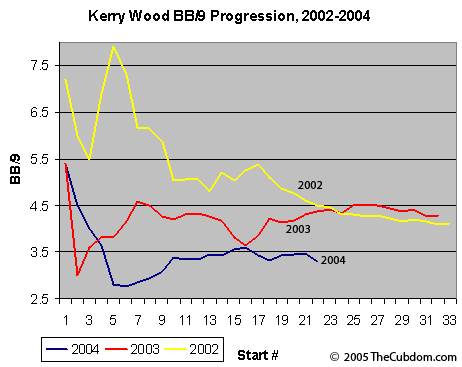
This last chart shows Wood's BB/9 rates from the past three years. Although there is some significant seperation between the three years, Wood finished 2002 and 2003 with similar numbers. In each of these seasons he walked about 4.5 men per 9 innings. However, he dropped that ratio by a walk per game down to 3.5 in 2004. On the surface, this looks promising as Wood has always struggled with his control. Indeed for a pitcher with a 1.25 WHIP and 4.5 BB/9, two fifths of his runners are allowed via the free pass. So, if a pitcher suddenly starts walking a batter less per game, his WHIP should fall about a tenth of a point. Wood's 2004 WHIP, as we already saw was virtually identical to his WHIP from 2002 and 2003. So, Wood is giving back that extra tenth of a point in WHIP to opponents hits. Indeed, a quick check of the numbers shows that opposing batters hit .244 against Wood in 2004. In 2003, batters only achieved a .203 BAA, which was down from .221 in 2002. Wood's career BAA is .214, so his 2004 season was a full 30 points over his career mark. Needless to say, this increase in opponent's batting average is quite concerning. I wonder if Wood eased up in three ball count situations attempting to avoid walks, and instead allowed hits. Posted by Byron at February 9, 2005 11:12 PM
|
|
|||||||||
| Subscribe to The Cubdom - get emails with the latest Cubs info and pictures | |
This post has been tagged: |
Great article, Byron. It's yet another interesting article I wish you used on goatriders!
Progression is the wrong way to look at these stats as a progression shows an increase in sample size as you move across the graph. You need to do this on a trailing set size of innings pitched.
Just like looking at Korey on a trailing 100 PA basis to see how streaky he is.
Chuck, I agree with you on the inappropriate use of progression. Trailing average would be more appropriate, but it leads to the problem of picking a better base.
I didn't want to use innings because of the natural step function inherent in measuring ERA by inning. If a guy goes out and gets shelled in one inning, it means he had a bad inning, not that he was wildly inconsistent.
I wouldn't mind doing trailing average by start, and in fact have planned on doing so after I finish Maddux and Rusch. I am going to do a trailing average by ERA over the course of our starters' careers.
The real advantage of looking at a progression chart is seeing significant inseason changes, i.e. Woods sudden increase in K/9 after his 21st start in 2002, or the fact that he virtually stopped walking guys after his 17th start in 2002.
Alright, you have a nice chart Byron, etc.
But a new question for you guys. Out of the Cubs entire starting rotation, who do you think would be the most likely candidate for a Cy?
Byron, I already know your answer. It's the same as mine.
There are only 2: Prior and Zamboni. And until Prior shows he's healthy, it's Zamboni being the most likely.
Using "starts" as your base won't work. You need to use something like 27 innings as your base.